VisualVM: JVM Debugging Tools


I'm writing this series about JVM debugging tools and how I find them useful. Hopefully these explorations are helpful for other engineers that have not used these tools before.
What is VisualVM?
From the documentation:
VisualVM is a visual tool integrating commandline JDK tools and lightweight profiling capabilities. Designed for both development and production time use.
VisualVM is a fairly easy tool for visualizing JVM processes that doesn't require much knowledge or setup to get some powerful insights. It is limited in how deeply you can explore different areas of non-heap JVM memory and doesn't have nearly as powerful tools for analyzing heap dumps, but because of its ease of use it is almost always the first tool I open in my profiling workflow.
How to Monitor and Profile a JVM Process
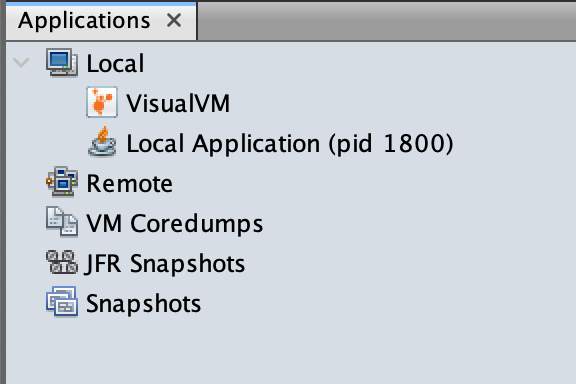
Connect to the daemon you want to observe.
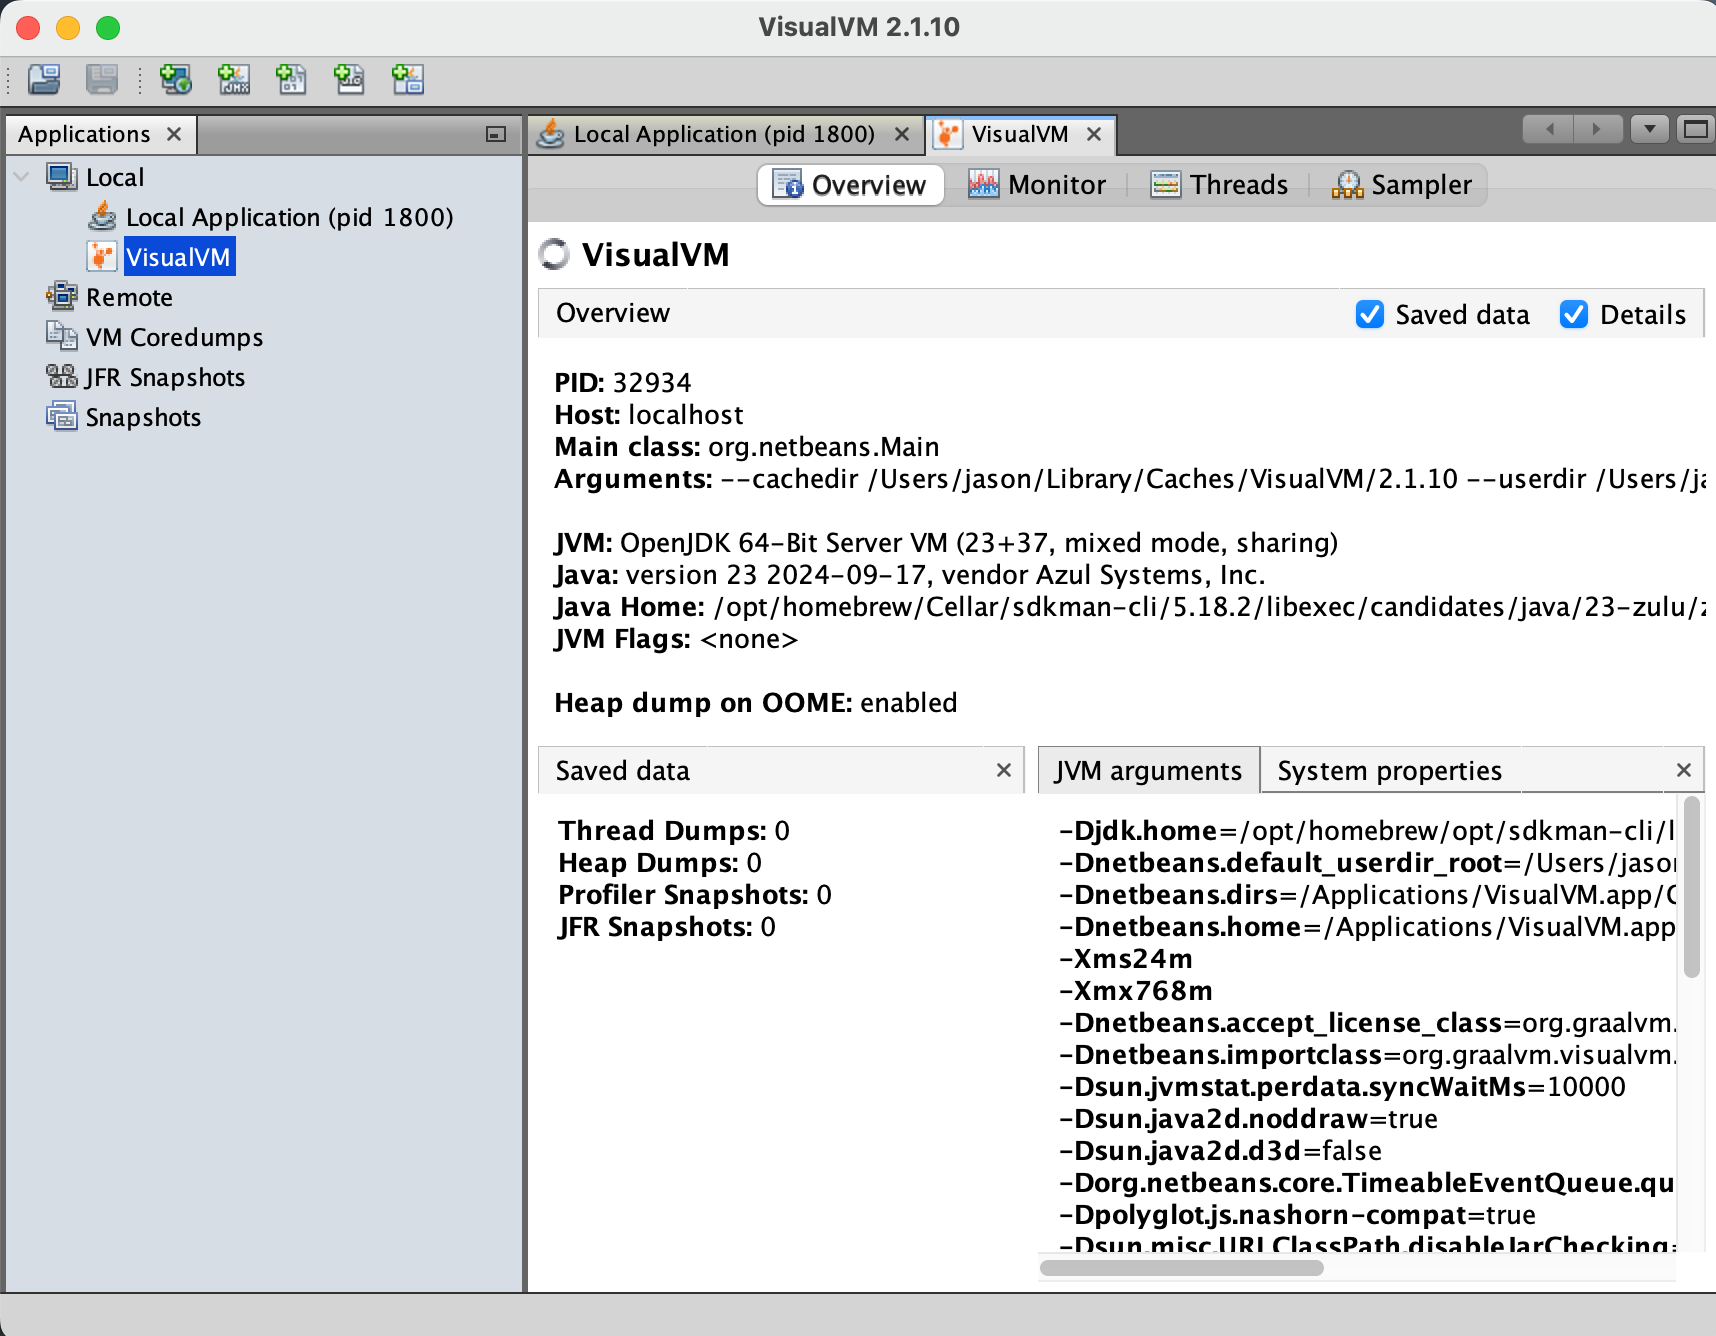
First you'll see the Overview tab. This is really neat for quickly inspecting JVM processes to see what JVM args they're actually using and debugging issues in setting them. It also exposes a number of defaults that some applications ship with.
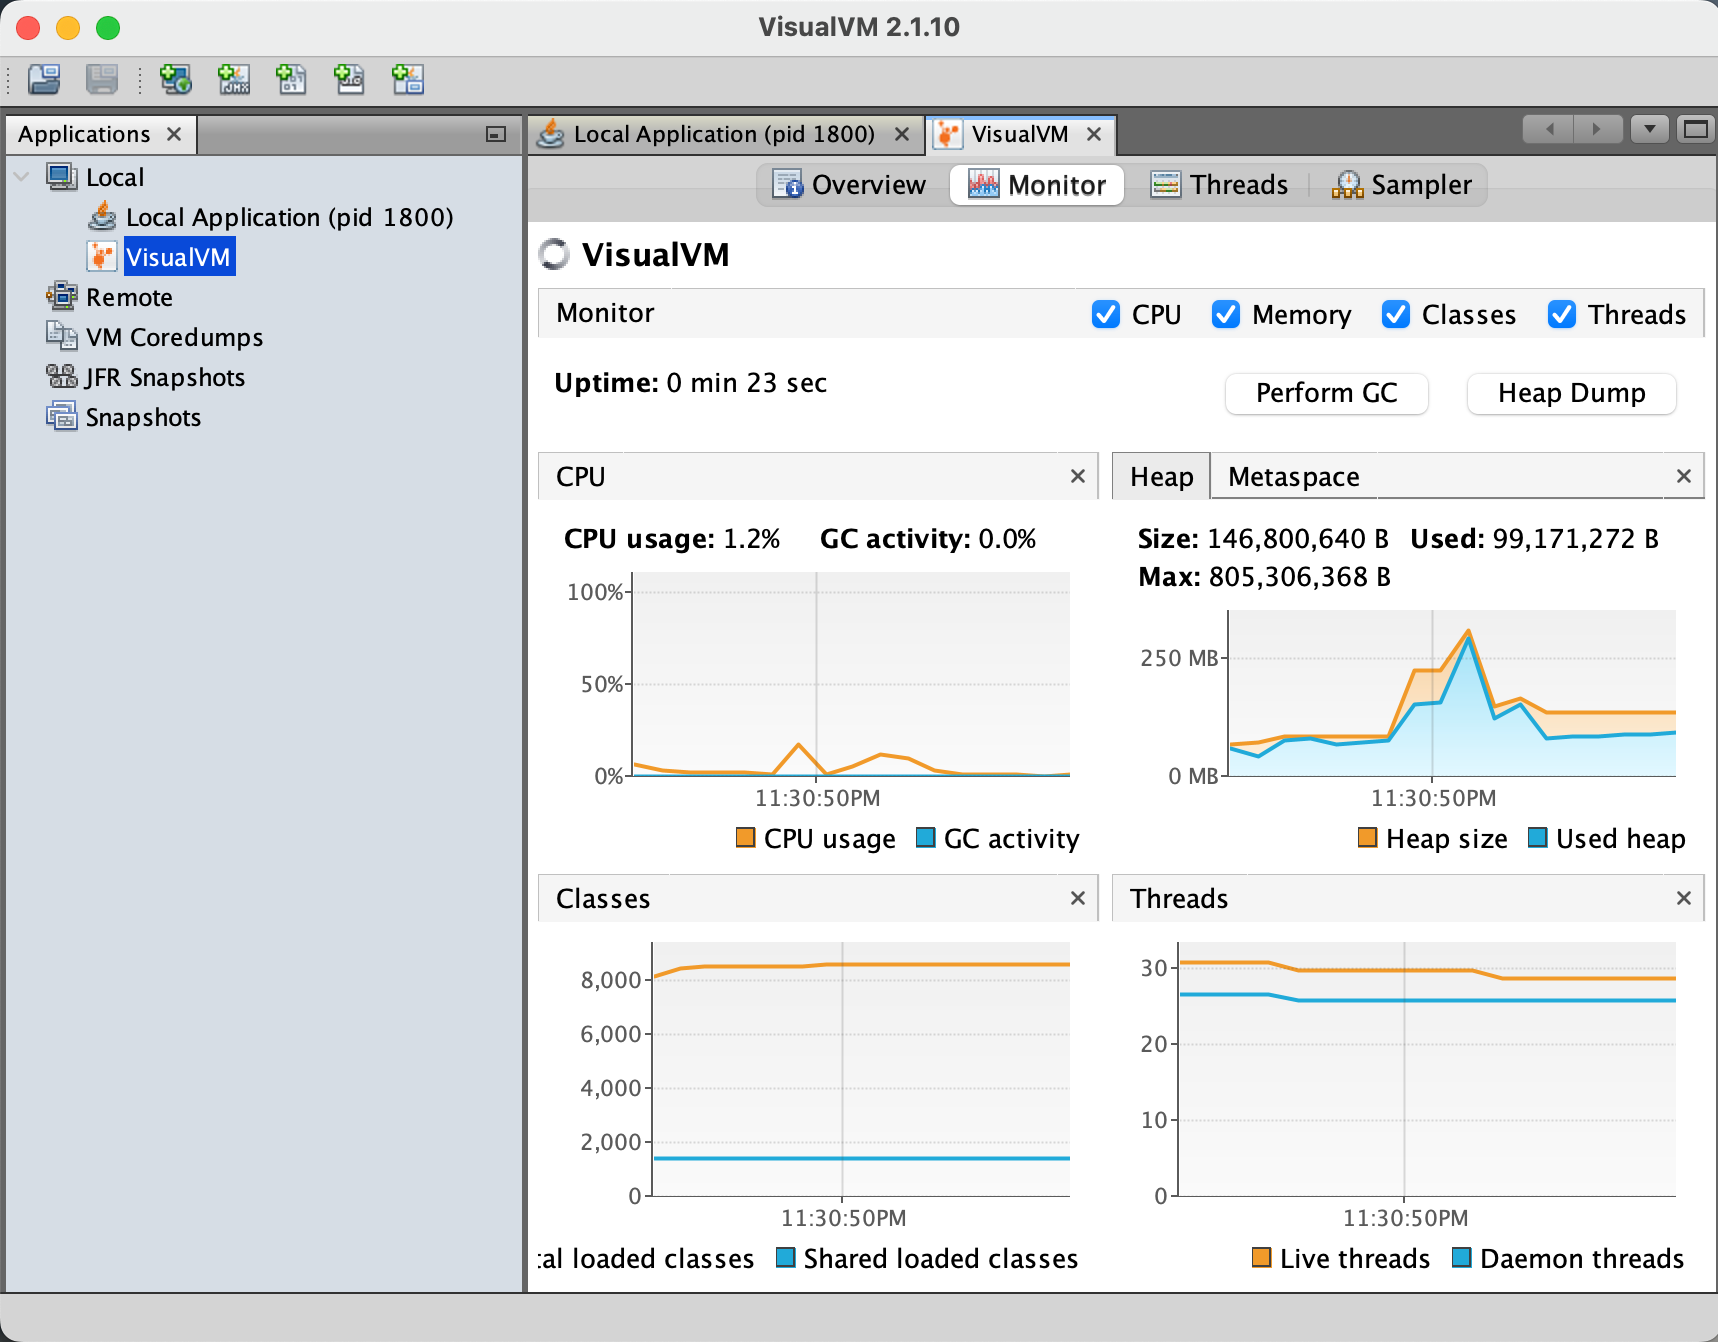
Heap dump whenever you need to, but do know that triggering one also triggers a GC event so its a bit "you can know the total heap or you can know what's in it".
If you do take a heap dump VisualVM it will be saved to /private/var/cc/<unintelligble>/ . If you want to actually analyze it in another tool or generally be able to find it again, just right click the heap dump and Save As... :
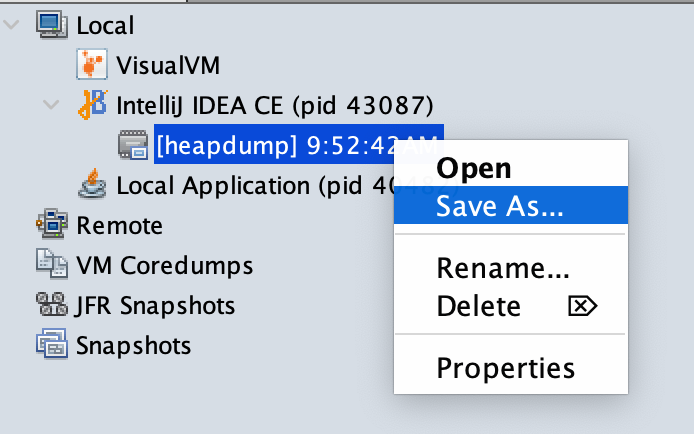
From there you can probably analyze it with some tool like Eclipse MemoryAnalyzer.
Shortcomings
VisualVM is bad at analzing non-heap memory. I say this because tools like JConsole can show you that Metaspace is not the only non-heap memory allocation a JVM process makes.
It also has sporadic issues with process death. This translates into showing JVM processes that are long dead as if they are still running. This seems more like a a bug than a lack of a feature and I hope to update this post when the issue is resolved.