CodeCache in JVM Builds
Understanding how the JVM caches compiiled native code.


This is a post in my JVM Args for Builds series where I break down how these settings effect JVM-based build systems. A number of these settings are complicated and all have compounding effects on each other as the JVM is a complex machine, but used the right way can be the difference between having a high-value feedback build system versus a high-cost one.
The JVM CodeCache [[1]] is an area of memory that the JVM uses to store compiled native code generated by the Just-In-Time (JIT) compiler. This memory region is distinct from the heap or Metaspace. Its not a topic that is covered in many JVM performance articles or documents[[8]], probably because the difference isn't very big, but that hasn't stopped questions[[2]] from being asked[[3]] about it.
TLDR;
If you're at the limits of your memory resources on local developer or CI machines fix that before messing with CodeCache because we're going to use a bit more memory for slightly greater speed.
If you're not, profile your build with jcmd $PID Compiler.CodeHeap_Analytics (recent JDK versions only) or VisualVM, observe its peak usage in your most memory intensive task + 20%. Use the greater of that value or 256MB to set -XX:ReservedCodeCacheSize .
The Kotlin Gradle Plugin defaults -XX:ReservedCodeCacheSize to 320m which is considerably larger. So I'd recommend Gradle should be at least 256m and Kotlin Daemon should be at least 320m for -XX:ReservedCodeCacheSize.
How does CodeCache work?
When a Java method is executed multiple times, the JIT compiler compiles it into native code and stores it in the CodeCache for faster subsequent execution. This is a crucial optimization because running compiled native code is much faster than interpreting Java bytecode every time the method is called. While it existed since JDK 8[[6]], in JDK 11 it was split up into separate heaps via JEP 197[[9]] in order to make optimizations on how and when compiled code would be cached at various tiers. This hasn't changed much until recent JDK versions [[7]] when parts of the compilation strategy were updated. The most important things to know is that CompileThreshold and OnStackReplacePercentage are the 2 settings which govern when a method is (re)compiled into the CodeCache and their defaults are already tuned well for JVM client and server applications [[4]] - but the default ReservedCodeCacheSize can force flushing of cached code more often is it is very low for JVM builds (48MB).
If you want to learn more about compilation tiers, client vs server JVM behavior, and an analysis of JEP 197[[9]] I recommend reading Julio's blog post on those topics.[[5]] While interesting, those topics aren't really relevant to JVM builds.
Measuring CodeCache
We need to put this in terms that make sense for a given codebase. Compiled bytecode gets stored as native code in the CodeCache, but how much space does any given line, method, class, or project take up?
Let's write an empty Java class with a Thread.sleep so we can easily run a profiler on it:
public class Simple {
    public static void main(String[] args) throws InterruptedException {
        Thread.sleep(5000);
    }
}
Depending on what your goals are and JDK version there are a few ways to observe it:
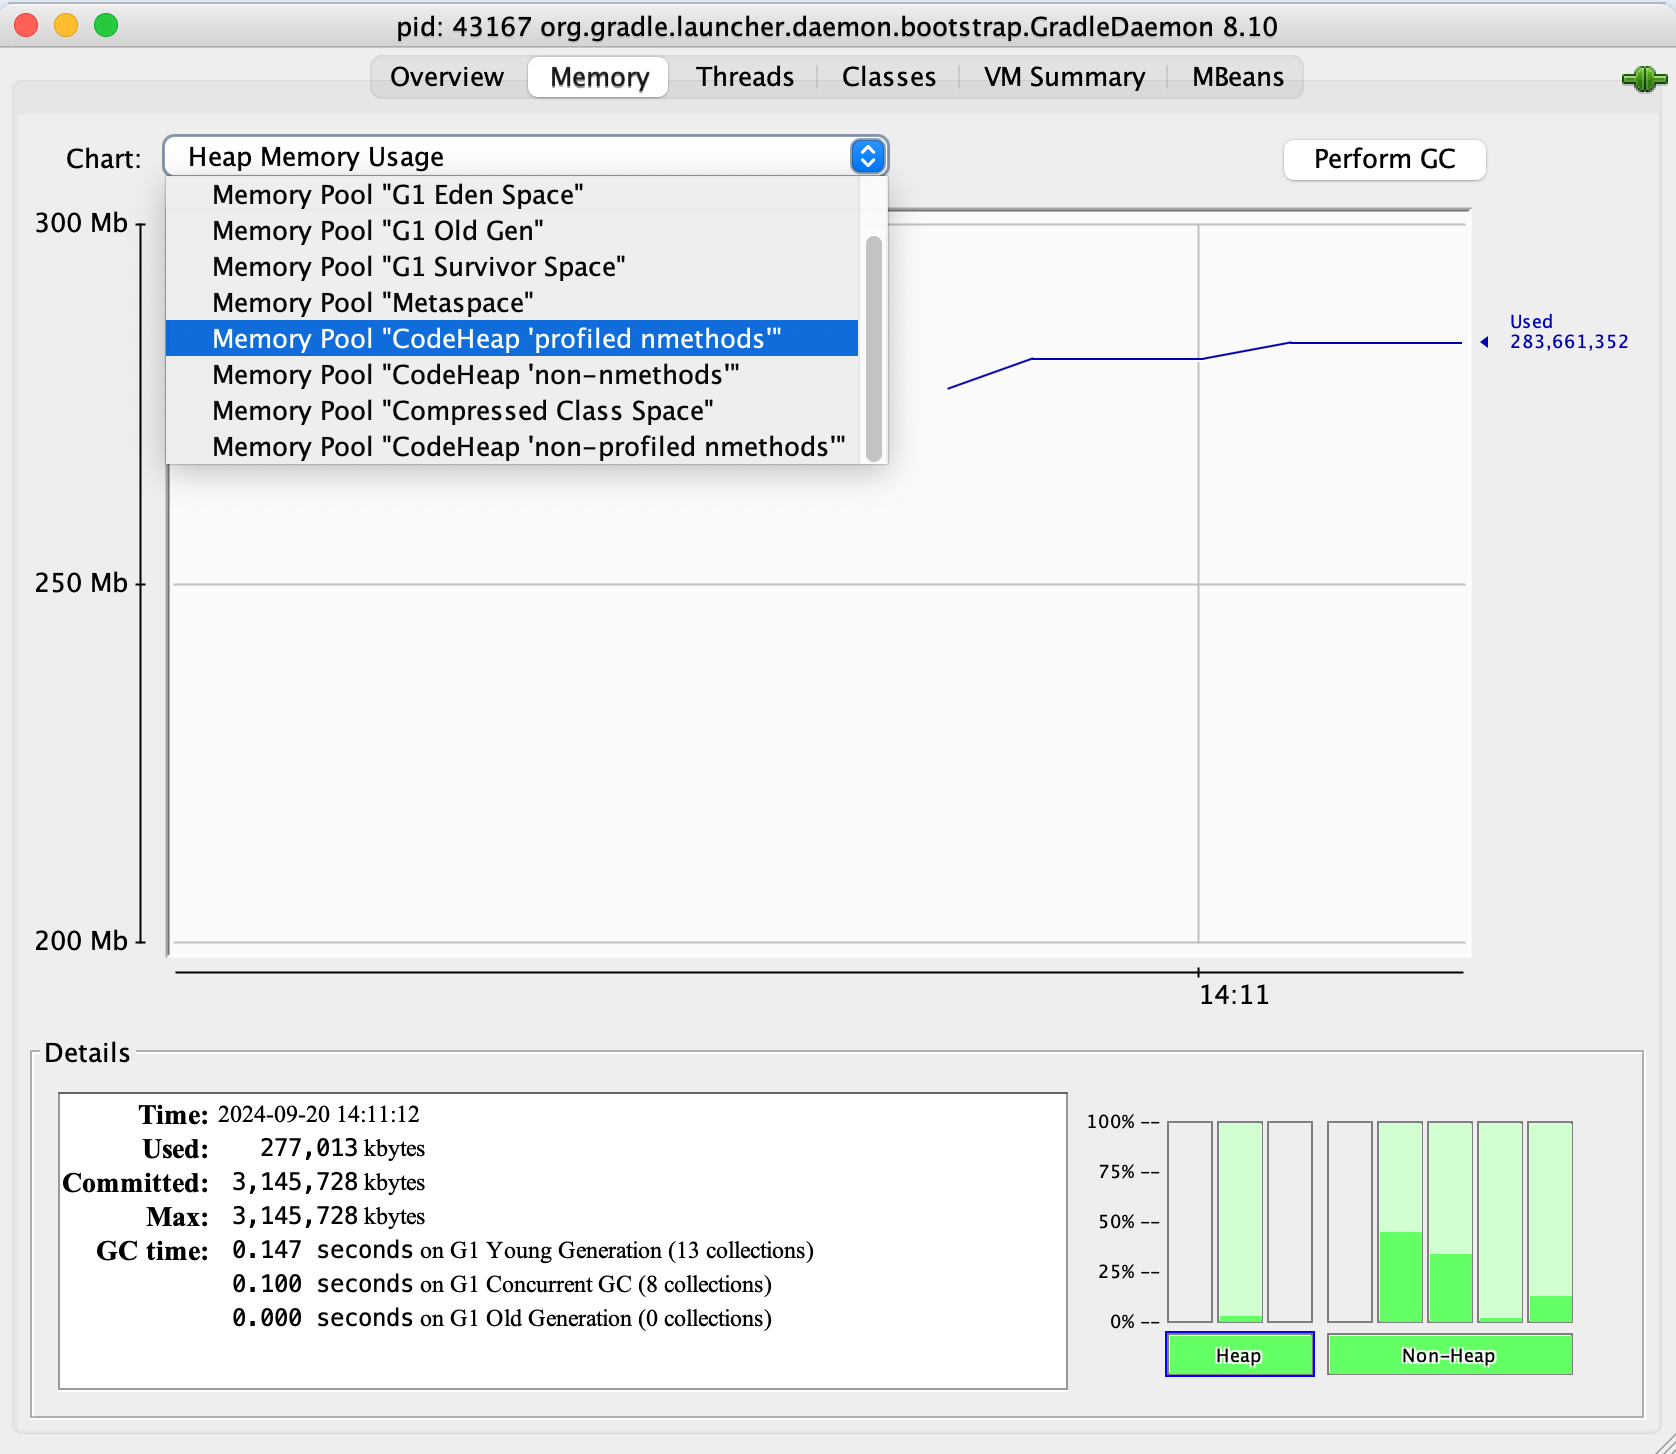
- jconsole which allows you to run a GUI that charts the various buckets of memory over time and will work with whatever JDK version you've got. If JAVA_HOME is set you should be able to just run
jconsolefrom your shell.
- JDK 16+:
jcmd <PID> Compiler.CodeHeap_Analytics - JDK 9+:
jcmd <PID> Compiler.codecache - JDK 8:
- +PrintCodeCache JVM arg, and then observing the final values emitted at the end of the build.
- +PrintCodeCacheOnCompilation JVM arg, which will output
I'm going to demonstrate how to look at all of this via jcmd <PID> Compiler.CodeHeap_Analytics , but unless you're looking to setup observability for your CI JVM processes you can take the jconsole approach.
jcmd Compiler.CodeHeap_Analytics approach
Before we truly dive into this we need to be able to grab the PID of the process we want to profile. Unless you're going to manually look this up in Activity Monitor every time I suggest scripting it like so:
PID=$(pgrep -f '.*java.*' | xargs -I{} ps -o pid= -o lstart= -p {} | sort -k2,3 | tail -n 1 | awk '{print $1}')
jcmd $PID Compiler.CodeHeap_Analytics > simple_code_cache_raw.txt
This is script will grab the latest Java PID, which for purposes of this analysis is fine in a JDK 16+ context. Don't put this in production automations.
simple_code_cache_raw.txt
======================
   General JIT info
======================

            JIT is :      on
  Compiler threads :      12

CodeCache overview
--------------------------------------------------------

         Reserved size :  245760 KB
        Committed size :    8064 KB
  Unallocated capacity :  240064 KB


__ CodeHeapStateAnalytics lock wait took      0.000 seconds _________


__ Compile & CodeCache (global) lock wait took      0.000 seconds _________

=============================================================
=  C O D E   H E A P   A N A L Y S I S   (general remarks)  =
=============================================================
   The code heap analysis function provides deep insights into
   the inner workings and the internal state of the Java VM's
   code cache - the place where all the JVM generated machine
   code is stored.

   This function is designed and provided for support engineers
   to help them understand and solve issues in customer systems.
   It is not intended for use and interpretation by other persons.


======================================================================================================
=  C O D E   H E A P   A N A L Y S I S   (used blocks) for segment CodeHeap 'non-profiled nmethods'  =
======================================================================================================
   The aggregate step takes an aggregated snapshot of the CodeHeap.
   Subsequent print functions create their output based on this snapshot.
   The CodeHeap is a living thing, and every effort has been made for the
   collected data to be consistent. Only the method names and signatures
   are retrieved at print time. That may lead to rare cases where the
   name of a method is no longer available, e.g. because it was unloaded.

   CodeHeap committed size 2496K (2M), reserved size 119168K (116M), 2% occupied.
   CodeHeap allocation segment size is 128 bytes. This is the smallest possible granularity.
   CodeHeap (committed part) is mapped to 624 granules of size 4096 bytes.
   Each granule takes 40 bytes of C heap, that is 24K in total for statistics data.
   The number of granules is limited to 512k, requiring a granules size of at least 2048 bytes for a 1GB heap.

+---------------------------------------------------------------------------+
|  Global CodeHeap statistics for segment CodeHeap 'non-profiled nmethods'  |
+---------------------------------------------------------------------------+
freeSpace        =        0k, nBlocks_free     =      0,      0.000% of capacity,      0.000% of max_capacity
usedSpace        =      367k, nBlocks_used     =    349,     14.704% of capacity,      0.308% of max_capacity
  Tier1 Space    =      183k, nBlocks_t1       =    234,      7.342% of capacity,      0.154% of max_capacity
  Tier2 Space    =      149k, nBlocks_t2       =    104,      5.985% of capacity,      0.125% of max_capacity
  Alive Space    =       34k, nBlocks_alive    =     11,      1.377% of capacity,      0.029% of max_capacity
    disconnected =        0k, nBlocks_disconn  =      0,      0.000% of capacity,      0.000% of max_capacity
    not entrant  =       34k, nBlocks_notentr  =     11,      1.377% of capacity,      0.029% of max_capacity
  stubSpace      =       34k, nBlocks_stub     =     11,      1.377% of capacity,      0.029% of max_capacity
ZombieBlocks     =        0. These are HeapBlocks which could not be identified as CodeBlobs.

Segment start          = 0x0000000114eb8000, used space      =     2496k
Segment end (used)     = 0x0000000115128000, remaining space =   116672k
Segment end (reserved) = 0x000000011c318000, reserved space  =   119168k

latest allocated compilation id = 1232
highest observed compilation id = 1230
Building TopSizeList iterations = 11042

Verifying collected data......done


+------------------------------------------------------------+
|  no free blocks found in CodeHeap 'non-profiled nmethods'  |
+------------------------------------------------------------+
==================================================================================================
=  C O D E   H E A P   A N A L Y S I S   (used blocks) for segment CodeHeap 'profiled nmethods'  =
==================================================================================================
   The aggregate step takes an aggregated snapshot of the CodeHeap.
   Subsequent print functions create their output based on this snapshot.
   The CodeHeap is a living thing, and every effort has been made for the
   collected data to be consistent. Only the method names and signatures
   are retrieved at print time. That may lead to rare cases where the
   name of a method is no longer available, e.g. because it was unloaded.

   CodeHeap committed size 2496K (2M), reserved size 119152K (116M), 2% occupied.
   CodeHeap allocation segment size is 128 bytes. This is the smallest possible granularity.
   CodeHeap (committed part) is mapped to 624 granules of size 4096 bytes.
   Each granule takes 40 bytes of C heap, that is 24K in total for statistics data.
   The number of granules is limited to 512k, requiring a granules size of at least 2048 bytes for a 1GB heap.

+-----------------------------------------------------------------------+
|  Global CodeHeap statistics for segment CodeHeap 'profiled nmethods'  |
+-----------------------------------------------------------------------+
freeSpace        =        0k, nBlocks_free     =      0,      0.000% of capacity,      0.000% of max_capacity
usedSpace        =     2353k, nBlocks_used     =    883,     94.291% of capacity,      1.975% of max_capacity
  Tier1 Space    =     2053k, nBlocks_t1       =    768,     82.257% of capacity,      1.723% of max_capacity
  Tier2 Space    =        0k, nBlocks_t2       =      0,      0.000% of capacity,      0.000% of max_capacity
  Alive Space    =      300k, nBlocks_alive    =    115,     12.034% of capacity,      0.252% of max_capacity
    disconnected =        0k, nBlocks_disconn  =      0,      0.000% of capacity,      0.000% of max_capacity
    not entrant  =      300k, nBlocks_notentr  =    115,     12.034% of capacity,      0.252% of max_capacity
  stubSpace      =      300k, nBlocks_stub     =    115,     12.034% of capacity,      0.252% of max_capacity
ZombieBlocks     =        0. These are HeapBlocks which could not be identified as CodeBlobs.

Segment start          = 0x000000010d318000, used space      =     2496k
Segment end (used)     = 0x000000010d588000, remaining space =   116656k
Segment end (reserved) = 0x0000000114774000, reserved space  =   119152k

latest allocated compilation id = 1232
highest observed compilation id = 1232
Building TopSizeList iterations = 26436

Verifying collected data......done


+--------------------------------------------------------+
|  no free blocks found in CodeHeap 'profiled nmethods'  |
+--------------------------------------------------------+
=============================================================================================
=  C O D E   H E A P   A N A L Y S I S   (used blocks) for segment CodeHeap 'non-nmethods'  =
=============================================================================================
   The aggregate step takes an aggregated snapshot of the CodeHeap.
   Subsequent print functions create their output based on this snapshot.
   The CodeHeap is a living thing, and every effort has been made for the
   collected data to be consistent. Only the method names and signatures
   are retrieved at print time. That may lead to rare cases where the
   name of a method is no longer available, e.g. because it was unloaded.

   CodeHeap committed size 3072K (3M), reserved size 7440K (7M), 41% occupied.
   CodeHeap allocation segment size is 128 bytes. This is the smallest possible granularity.
   CodeHeap (committed part) is mapped to 768 granules of size 4096 bytes.
   Each granule takes 40 bytes of C heap, that is 30K in total for statistics data.
   The number of granules is limited to 512k, requiring a granules size of at least 2048 bytes for a 1GB heap.

+------------------------------------------------------------------+
|  Global CodeHeap statistics for segment CodeHeap 'non-nmethods'  |
+------------------------------------------------------------------+
freeSpace        =       46k, nBlocks_free     =      6,      1.501% of capacity,      0.620% of max_capacity
usedSpace        =     2974k, nBlocks_used     =    442,     96.834% of capacity,     39.983% of max_capacity
  Tier1 Space    =        0k, nBlocks_t1       =      0,      0.000% of capacity,      0.000% of max_capacity
  Tier2 Space    =        0k, nBlocks_t2       =      0,      0.000% of capacity,      0.000% of max_capacity
  Alive Space    =        0k, nBlocks_alive    =      0,      0.000% of capacity,      0.000% of max_capacity
    disconnected =        0k, nBlocks_disconn  =      0,      0.000% of capacity,      0.000% of max_capacity
    not entrant  =        0k, nBlocks_notentr  =      0,      0.000% of capacity,      0.000% of max_capacity
  stubSpace      =     2974k, nBlocks_stub     =    442,     96.834% of capacity,     39.983% of max_capacity
ZombieBlocks     =        0. These are HeapBlocks which could not be identified as CodeBlobs.

Segment start          = 0x0000000114774000, used space      =     3072k
Segment end (used)     = 0x0000000114a74000, remaining space =     4368k
Segment end (reserved) = 0x0000000114eb8000, reserved space  =     7440k

latest allocated compilation id = 1232
highest observed compilation id = 0
Building TopSizeList iterations = 6908

Verifying collected data......done
Now that's quite a wall of text and I'm not even including the other ~37k lines of output. So I wrote a simple script to parse it for data I want to look at:
inspect_code_cache.sh
#!/bin/bash

# Find the latest Java process ID
PID=$(pgrep -f '.*java.*' | xargs -I{} ps -o pid= -o lstart= -p {} | sort -k2,3 | tail -n 1 | awk '{print $1}')

if [ -z "$PID" ]; then
    echo "No process found."
    exit 1
fi

# Run jcmd to get the Compiler.CodeHeap_Analytics output
OUTPUT=$(jcmd $PID Compiler.CodeHeap_Analytics)
echo "Monitoring JVM CodeCache (PID: $PID)"

# Function to convert size with units (KB, MB) into bytes
convert_to_bytes() {
    local value=$1
    local unit=$2

    case $unit in
        KB)
            echo $(printf "%.0f" $(echo "$value * 1024" | bc))
            ;;
        k)
            echo $(printf "%.0f" $(echo "$value * 1024" | bc))
            ;;
        K)
            echo $(printf "%.0f" $(echo "$value * 1024" | bc))
            ;;
        MB)
            echo $(printf "%.0f" $(echo "$value * 1024 * 1024" | bc))
            ;;
        m)
            echo $(printf "%.0f" $(echo "$value * 1024 * 1024" | bc))
            ;;
        M)
            echo $(printf "%.0f" $(echo "$value * 1024 * 1024" | bc))
            ;;
        *)

            echo $(printf "%.0f" $value)  # Already in bytes, ensure it's an integer
            ;;
    esac
}

# Function to extract the used and committed space for a segment
extract_code_cache_segment_data() {
  local segment_name=$1
  local used_space=$(echo "$OUTPUT" | sed -n "/Global CodeHeap statistics for segment CodeHeap '$segment_name'/,/Verifying collected data/p" | grep 'usedSpace' | awk '{print $3}' | head -1)
  local used_space_value=$(echo "$used_space" | grep -o -E '[0-9]+')
  local used_space_unit=$(echo "$used_space" | grep -o -E '[^0-9, ]+')
  local commited_size=$(echo "$OUTPUT" | sed -n "/C O D E   H E A P   A N A L Y S I S   (used blocks) for segment CodeHeap '$segment_name'/,/Verifying collected data/p" | grep "CodeHeap committed size" | awk '{print $4}' | head -1)
  local commited_size_value=$(echo "$commited_size" | grep -o -E '[0-9]+')
  local commited_size_unit=$(echo "$commited_size" | grep -o -E '[^0-9, ]+')
  echo "$(convert_to_bytes $used_space_value $used_space_unit)" "$(convert_to_bytes $commited_size_value $commited_size_unit)"
}

# Extract data for each segment
non_profiled_data=$(extract_code_cache_segment_data 'non-profiled nmethods')
profiled_data=$(extract_code_cache_segment_data 'profiled nmethods')
non_nmethods_data=$(extract_code_cache_segment_data 'non-nmethods')

# Split the data into used and committed for each segment
non_profiled_used=$(echo $non_profiled_data | awk '{print $1}')
non_profiled_committed=$(echo $non_profiled_data | awk '{print $2}')
non_profiled_used_value=$(echo "$non_profiled_used" | grep -o -E '[0-9]+')
non_profiled_committed_value=$(echo "$non_profiled_committed" | grep -o -E '[0-9]+')

profiled_used=$(echo $profiled_data | awk '{print $1}')
profiled_committed=$(echo $profiled_data | awk '{print $2}')
profiled_used_value=$(echo "$profiled_used" | grep -o -E '[0-9]+')
profiled_committed_value=$(echo "$profiled_committed" | grep -o -E '[0-9]+')

non_nmethods_used=$(echo $non_nmethods_data | awk '{print $1}')
non_nmethods_committed=$(echo $non_nmethods_data | awk '{print $2}')
non_nmethods_used_value=$(echo "$non_nmethods_used" | grep -o -E '[0-9]+')
non_nmethods_committed_value=$(echo "$non_nmethods_committed" | grep -o -E '[0-9]+')

# Total up the used and committed space
total_used_value=$((non_profiled_used_value + profiled_used_value + non_nmethods_used_value))
total_committed_value=$((non_profiled_committed_value + profiled_committed_value + non_nmethods_committed_value))

# Print the results
echo "=== CodeCache Breakdown ==="
echo "Non-profiled nmethods:"
echo "  Used: $((non_profiled_used / 1024)) KB"
echo "  Committed: $((non_profiled_committed / 1024)) KB"
echo ""
echo "Profiled nmethods:"
echo "  Used: $((profiled_used / 1024)) KB"
echo "  Committed: $((profiled_committed / 1024)) KB"
echo ""
echo "Non-nmethods:"
echo "  Used: $((non_nmethods_used / 1024)) KB"
echo "  Committed: $((non_nmethods_committed / 1024)) KB"
echo ""
echo "=== Total ==="
echo "Total Used: $((total_used_value / 1024)) KB"
echo "Total Committed: $((total_committed_value / 1024)) KB"
echo ""
That script allows me to see what I care about: the usage and committed sizes of the 3 areas of the CodeCache. profiled and non-profiled nmethods are the areas I care about because they're going to scale as a codebase grows. So if I run this against my Simple Java class I get the following:
Monitoring JVM CodeCache (PID: 91845)
=== CodeCache Breakdown ===
Non-profiled nmethods:
  Used: 367 KB
  Committed: 2496 KB

Profiled nmethods:
  Used: 2353 KB
  Committed: 2496 KB

Non-nmethods:
  Used: 2974 KB
  Committed: 3072 KB

=== Total ===
Total Used: 5694 KB
Total Committed: 8064 KB
Okay, now we have a decent way of measuring what's happening. What does this look like against a typical JVM build?
First, I'm going to change out how I look for PIDs to focus on Gradle daemons:
PID=$(pgrep -f '.*GradleDaemon.*' | xargs -I{} ps -o pid= -o lstart= -p {} | sort -k2,3 | tail -n 1 | awk '{print $1}')
jcmd $PID Compiler.CodeHeap_Analytics
java -> GradleDaemon
Currently it doesn't specify anything for CodeCache so its just using JVM defaults. I'm going to run it on my local machine for 10 iterations so the CodeCache can get fully warmed up by the JIT recognizing what native code should be cached at the C1 and C2 tiers, and do so again for a few experiments:
BUILD SUCCESSFUL in 33s
773 actionable tasks: 769 executed, 4 up-to-date
BUILD SUCCESSFUL in 19s
773 actionable tasks: 769 executed, 4 up-to-date
BUILD SUCCESSFUL in 17s
773 actionable tasks: 769 executed, 4 up-to-date
BUILD SUCCESSFUL in 17s
773 actionable tasks: 769 executed, 4 up-to-date
BUILD SUCCESSFUL in 17s
773 actionable tasks: 769 executed, 4 up-to-date
BUILD SUCCESSFUL in 17s
773 actionable tasks: 769 executed, 4 up-to-date
BUILD SUCCESSFUL in 17s
773 actionable tasks: 769 executed, 4 up-to-date
BUILD SUCCESSFUL in 17s
773 actionable tasks: 769 executed, 4 up-to-date
BUILD SUCCESSFUL in 17s
773 actionable tasks: 769 executed, 4 up-to-date
BUILD SUCCESSFUL in 17s
773 actionable tasks: 769 executed, 4 up-to-date

Monitoring JVM CodeCache (PID: 17104)
=== CodeCache Breakdown ===
Non-profiled nmethods:
  Used: 60399 KB
  Committed: 65792 KB

Profiled nmethods:
  Used: 54721 KB
  Committed: 93056 KB

Non-nmethods:
  Used: 2565 KB
  Committed: 4672 KB

=== Total ===
Total Used: 117685 KB
Total Committed: 163520 KB
Setting CodeCache to 256MB without delving into the more specific parameters[[9]] just splits that size between non-profiled and profiled nmethods.
BUILD SUCCESSFUL in 30s
773 actionable tasks: 769 executed, 4 up-to-date
BUILD SUCCESSFUL in 18s
773 actionable tasks: 769 executed, 4 up-to-date
BUILD SUCCESSFUL in 17s
773 actionable tasks: 769 executed, 4 up-to-date
BUILD SUCCESSFUL in 17s
773 actionable tasks: 769 executed, 4 up-to-date
BUILD SUCCESSFUL in 16s
773 actionable tasks: 769 executed, 4 up-to-date
BUILD SUCCESSFUL in 16s
773 actionable tasks: 769 executed, 4 up-to-date
BUILD SUCCESSFUL in 16s
773 actionable tasks: 769 executed, 4 up-to-date
BUILD SUCCESSFUL in 16s
773 actionable tasks: 769 executed, 4 up-to-date
BUILD SUCCESSFUL in 16s
773 actionable tasks: 769 executed, 4 up-to-date
BUILD SUCCESSFUL in 16s
773 actionable tasks: 769 executed, 4 up-to-date

Monitoring JVM CodeCache (PID: 988)
=== CodeCache Breakdown ===
Non-profiled nmethods:
  Used: 65865 KB
  Committed: 127360 KB

Profiled nmethods:
  Used: 61784 KB
  Committed: 127344 KB

Non-nmethods:
  Used: 2582 KB
  Committed: 7440 KB

=== Total ===
Total Used: 130231 KB
Total Committed: 262144 KB
There is a consistent speed improvement on every run, the greatest of which happens on the very first run.
I did run some other experiments at other sizes but anything under 240MB seems to force the CodeCache to merge its 3 heaps into 1.
For larger codebases this likely has a bigger effect, especially on clean builds or where Gradle's configuration cache has been invalidated.
Build System Recommendations
Regardless of your project's size you can likely have a small benefit from setting CodeCache to a reasonable size. I would recommend profiling your build with jcmd $PID Compiler.CodeHeap_Analytics and either setting -XX:ReservedCodeCacheSize to the peak measured in your most memory intensive task + 20% or 256MB, whichever is greater.
The Kotlin Gradle Plugin defaults -XX:ReservedCodeCacheSize to 320m which is considerably larger. For now I recommend everyone at least continue to use that value instead of something lower.
Thank You
John Buhanan for the review and kind encouragement!
Update: Thanks Josh Friend for the corrections!
References:
- Advanced Garbage Collection Options - Oracle JavaSE Docs [[1]]
- "The meaning of the IBM JVM parameter -Xcodecache" [[2]]
- "Oracle JVM 8: when Codecache flushing is enabled, how much is flushed?" [[3]]
- "Oracle Java SE Embedded: Developer's Guide | Codecache Tuning" [[4]]
- "Understand JVM and JIT Compiler" by Júlio Falbo [[5]]
- OpenJDK 8 source - advancedThresholdPolicy.hpp [[6]]
- OpenJDK 22 source - compilationPolicy.hpp [[7]]
- "Java HotSpot Virtual Machine Performance Enhancements" - Oracle JavaSE 11 docs [[8]]
- "JEP 197 - Segmented Code Cache" [[9]]
[[1]]: Advanced Garbage Collection Options https://docs.oracle.com/javase/8/docs/technotes/tools/unix/java.html#BABFAFAE
[[2]]: "The meaning of the IBM JVM parameter -Xcodecache" https://stackoverflow.com/questions/18025118/the-meaning-of-the-ibm-jvm-parameter-xcodecache/18025309#18025309
[[3]]: "Oracle JVM 8: when Codecache flushing is enabled, how much is flushed?" https://stackoverflow.com/questions/38173592/oracle-jvm-8-when-codecache-flushing-is-enabled-how-much-is-flushed
[[4]]: "Oracle Java SE Embedded: Developer's Guide | Codecache Tuning" https://docs.oracle.com/javase/8/embedded/develop-apps-platforms/codecache.htm
[[5]]: "Understand JVM and JIT Compiler" by Júlio Falbo https://julio-falbo.medium.com/understand-jvm-and-jit-compiler-part-4-9738194ad06e
[[6]]: OpenJDK 8 source - advancedThresholdPolicy.hpp https://hg.openjdk.org/jdk8u/jdk8u/hotspot/file/2b2511bd3cc8/src/share/vm/runtime/advancedThresholdPolicy.hpp#l34
[[7]]: OpenJDK 22 source - compilationPolicy.hpp https://github.com/openjdk/jdk/blob/a0794e0a054c5e7ed051efa6362726cdd7598255/src/hotspot/share/compiler/compilationPolicy.hpp#L38
[[8]]: "Java HotSpot Virtual Machine Performance Enhancements" - Oracle JavaSE 11 docs https://docs.oracle.com/en/java/javase/11/vm/java-hotspot-virtual-machine-performance-enhancements.html
[[9]]: "JEP 197 - Segmented Code Cache" https://openjdk.org/jeps/197